Inexpensive ways to test and tune the Maslow?

Don’t wan’t to hijack this thread too much but this is exactly what I’m testing. Trying to put some real numbers to the accuracy of the layout simulator. Still have 3-4mm error at the edges within the green area.

With a 1’ extension on each side of the X axis the motors no longer hit the frame. I tried the chopped ears but there was way too much flex in the machine.

1 Like

Is this extending out the mounting points or belts or both. What did use to extend the belts?

Nice to hear it worked, looks good too.

I’m thinking we should come up with a standard gcode file that we can run and share results. It would need to include direct changes. Tests for linear x and y and diagonal moves.

Dano

Here’s mine. 100mm then 50mm to the edges (you’ll need supports on the ends). It’s a drill operation with a 1/8" plunge. It’ll smash up the sharpie a bit but works just fine.

sharpie test grid.nc (13.3 KB)

Here’s the .stl for the pen holder. It’s a bit loose and I might revise, but works with some teflon tape. I recommend PTEG. Rip the black sharpie plastic part out of the gray body and trim the ink tube down.
sharpie holder v1.stl (256.0 KB)

I built little T shaped attachments and some 3/4 ply on top then screwed them to the frame.


1 Like

IMHO, this begs the following questions:

  • What data would be useful for tuning the software?
  • What are some cheap and easy ways to collect data?
  • Might a group spreadsheet or wiki page be useful?

It also occurs to me that some problems may be mechanical in nature (e.g., cable binding), so a close visual inspection should be performed before running any tests.

One open calibration issue has to do with setting up a physical reference. One approach would be to mount a laser pointer on the sled, shining down on a printed grid. However, the Maslow’s scale turns into an obstacle:

  • Even “large” or even “giant” format graph paper sizes don’t go up to 4’ x 8’.

  • One could use a straightedge and a pen to mark the spoil board in a grid pattern, but this sounds both tedious and error-prone.

  • ???

Rich Morin wrote:

  • What data would be useful for tuning the software?

I don’t think we are even at the point of trying to tune the software, I think
we are still trying to figure out if there is something that needs tuning

  • What are some cheap and easy ways to collect data?

I think we want to have people build a machine that works, then use the frame
calculators to see if they have potentially problematic areas, then see what
happens as the machine gets into those areas. We need to know the calibration
fitness score, and I think it would be useful to manually measure the anchors to
see how they compare. We also need to know horizontal vs vertical.

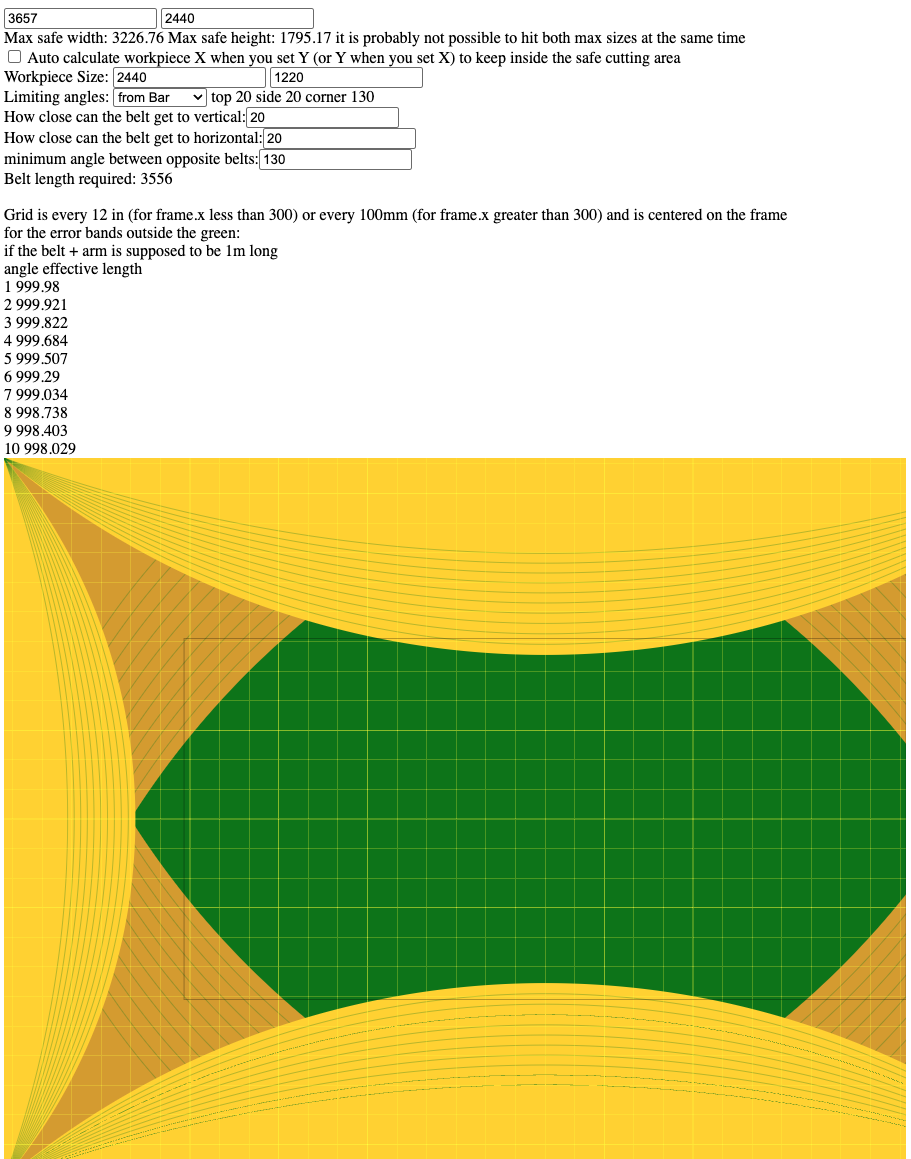
For example, kyleschoen just posted his frame dimensions in the screenshot of
the calculator. If you look at the calculator, you see that a line along the top
of the workpiece would start deep in the yellow corner, go into the green, then
into the yellow top, then the green, then deep into the yellow of the other
corner. If such a cut is made, how straight is it? how does any deviation of the
cut map into the different bands of yellow?

If you just cut/draw a grid (say every 50mm to 100mm do you have some area
that’s very good and other areas that show distortions (either in distances or
in straightness, i.e. is it solidly at 50mm horizontal spacing in the center,
then grow or shrink as you move away from the center?

are there other things that show up that we don’t expect? (I think there
probably will be)

  • Might a group spreadsheet or wiki page be useful?

possibly

It also occurs to me that some problems may be mechanical in nature (e.g., cable binding), so a close visual inspection should be performed before running any tests.

One open calibration issue has to do with setting up a physical reference. One approach would be to mount a laser pointer on the sled, shining down on a printed grid. However, the Maslow’s scale turns into an obstacle:

  • Even “large” or even “giant” format graph paper sizes don’t go up to 4’ x 8’.

even worse, when you try to get large format prints from kinkos/etc they end up
being pretty accurate across the page, but when printing on a long roll, the
distance along the roll isn’t very accurate.

do a little reading on the problems involved by looking up ‘optical calibration’
in the old threads

  • One could use a straightedge and a pen to mark the spoil board in a grid pattern, but this sounds both tedious and error-prone.

measuring long distances with high accuracy is hard, your straightedge and tape
measure may be introducing error. There is an old thread “in search of accurate
measurements” that’s worth reading

David Lang

1 Like

I just measured two sides and will upload an X skew and Y skew spreadsheet, but what I’m seeing doesn’t really align with the frame calculator. The corners actually seem to be a little more accurate than the center where the calculator shows all green. So far I’m seeing around -2mm at 1150mm from the origin, and about -4 to -5mm at 1200 from the origin in the X axis. Maybe about -2mm in the corners. The Y axis is about -1mm off at about 400-600 from the origin and a little worse in the corner. This coincides with my previous post about the X axis having more issues than the Y.

measuring long distances with high accuracy is hard, your straightedge and tape
measure may be introducing error. There is an old thread “in search of accurate
measurements” that’s worth reading

I first tried measuring from the origin which isn’t that difficult but noticed the middle was fine. Measuring isn’t really that difficult because the machine is very accurate up until 200-300mm to the edges (this is with my extended frame). So I just use a ruler with my 100-50mm dots and mark how far off they are.

What I’m really seeing with my data (when I finish recording I’ll share) is that the direction the machine moves in really changes the skew. Moving toward the edge in the X direction is far more accurate. Also the dot pattern I created moved in rows and if you try to line the dots up in the column Y axis they are shifted in relation to the direction they move. So there’s definitely something going on with how the machine is pulling across the surface. Might be stretch on the longer side of the belts. Consider pulling away from the edge, the longer belts are doing the work of moving the machine and possibly stretching more. @dlang and @bar is it possible to do some torque vectoring in the software and have some arms pull harder to compensate for this?

Since I moved the machine in the X axis, I might have to try another grid path that moves along the Y and see if the tension of travel skews the machine more in that direction as well. Kind of a lot of variables here.

TL:DR:

  • Very accurate until ~200-300 MM from the edges
  • X axis is worse than Y, -2mm to -5mm near the edges
  • X axis gets pretty bad at 1200 mm from the origin
  • The corners actually look better than the center, which questions the frame analysis tool
  • The direction the machine is moving in the X axis really effects the skew, I think this might be due to belt stretch
2 Likes

Here’s the right side X axis. Pretty clear to see how the skew is worse pulling away from the edge. I’ll measure the left side tomorrow as well as the Y axis.

4 Likes