I have two problems with my Maslow and I am wondering if they may be related? Looking for some advice
Issue #1
I have one motor (top right) that consistently draws more current than the other three. On the new motor current debug screen (nice work there @bar ) I can see it drawing almost double the peak current of the other motors
Sometimes this motor won’t retract all the way taking two or three presses of the ‘retract all’ button to finally retract the belt. At other times it retracts just fine.
I have increased the retraction (and calibration) forces in the config
Extending the belts works as expected.
Issue #2
I can’t get the calibration/find anchors to get the dimensions expected. The numbers generated for the frame dimensions are up to 60mm out. This is even with a fitness result consistently over 1.
After automatic calibration my X / Y dimensional accuracy when cutting (or drawing to save wasting plywood) is out by 2 or 3 %. Interestingly this is approximately the same % as the error in the calibration (60mm over 3000mm is 2%) and the errors in the X and Y dimensions seem to match between calibration and cutting
Entering in manually calculated frame values (using @dlang ’s neat calculator) gives a better result with errors closer to 1%, but they are still there
I am using firmware v1.12
So, my questions are:
could the high current motor/ arm/ belt be the cause of the poor calibration / dimensional inaccuracy
Is it worth trying to prove this by doing something like swapping the arms about (and adjusting z offsets to match) to see if the errors move with the arm?
Should I disassemble the Maslow to ‘service’ that arm, and if so what am I looking for when I do so?
It certainly seems possible that they are related, although the fact that you are consistently getting pretty solid fitness values when finding the anchor locations says that we’re getting good measurements.
Is this in horizontal or vertical orientation?
In vertical orientation that top right motor is going to have gravity making sure it always stays tight which might help with getting good fitness since we’re only using the lower two belts to pull in and take measurements in the vertical mode.
Do you consistently find the same anchor points, they’re just off?
Horizontal orientation
Concrete floor with bolt in anchors (ridgid)
I’ve run calibration 6 times over the last three days to see what happens
The results move about - see table below
I got one calibration close to my manual measurements but the others move about by up to 150mm
This is the config I am using:
I ran some more calibrations today to see what would happen.
It is interesting to see the results plotted as graphs.
In the plots below the blue column is the manual measurements
The other colours (from red through to pale blue) are from earliest to most recent calibration
This looks like something mechanical is changing over time… possible belt stretch, possibly friction changing as parts wear in … or possibly temperature.
Each calibration run started with the same YAML file using the same set of measured / calculated values for MaslowKinematics
The results are better - less variability - see plot below
Today I’ve calculated the values for frame dimensions from the calibration results and plotted these.
The left column (blue) is my manual measurement / calculated values, the black horizotal line shows this projected across the other 17 dimesions calculations from the Maslow calibrations.
The five columns on the right are today’s calibration runs - each starting from the manually calculated dimensions.
The error / deviation from measured dimensions has moved from over 7% to less than 1% today
Fitness today averaged 1.6
What does this all mean?
I think it means the results of a Maslow calibration are significantly dependant on the existing values in the MaslowKinematics section of the YAML file. Anyone starting with the YAML in the distribution might suffer if their frame is not the same size as was used to make the distributed YAML.
Perhaps the setup process could allow for the entry of the approximate dimensions of the frame and calculate a new set of MaslowKinematics values before it starts … but this would introduce a great potention for human error.
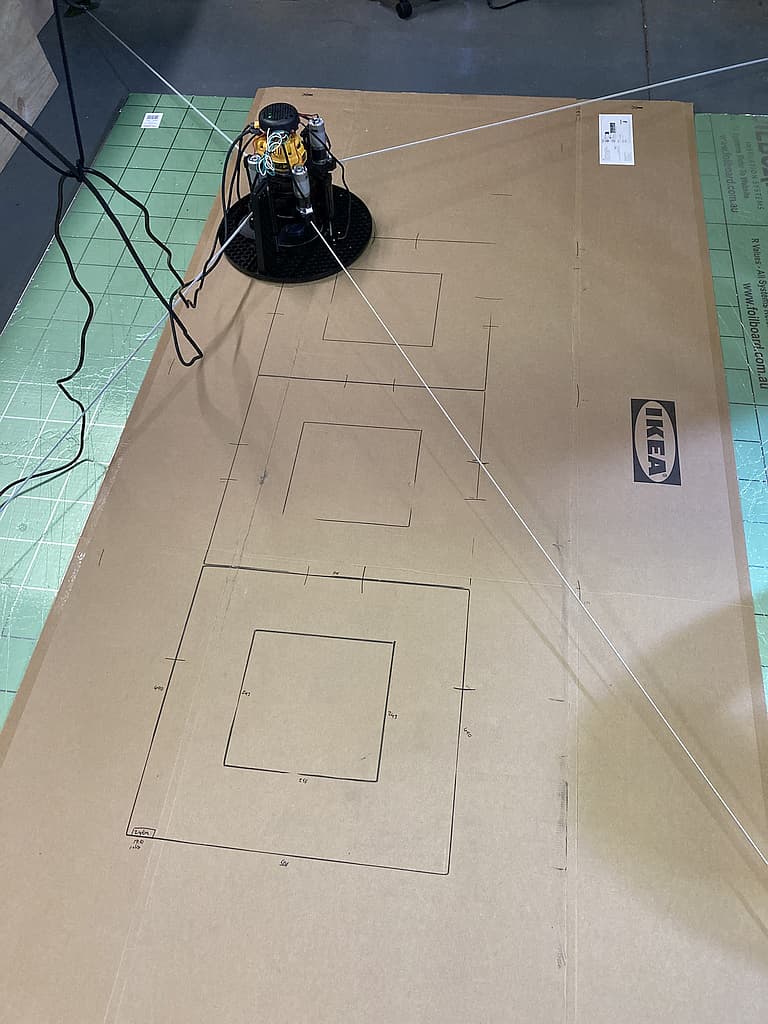
Tommorow I’ll do some test plots with my marker pen fitting in the maslow and see how close to square I can get with the best of these values in the MaslowKinematics.
I think I’ll try a new technique to plot a grid of points, rather than drawing boxes as I suspect the marker pen might ’drag’ a little in its fitting and introduce a couple of mm of movement. A grid of points where I retract the pen while moving and then extend the pen to draw a dot should have it centred each time it marks a grid dot.
see about getting some paper tablecloths to draw on. the problem is that they
will want to move so you will need to tape them to something more solid.
I have a gcode file at http://lang.hm/maslow/test-grid.4x8.nc that draws a grid
at 4" intervals. since it does it with long lines, the pen dragging should only
be an issue at the corners.
Although rather than asking for user input (which I’ve found is a source of potential error), I think that we should focus on building the system so that it is robust to not being dependent on the initial values in the .yaml file.
The question then is how can we make the system more aggressively converge to the one true answer?
A while back someone threw out an idea which I thought was quite good which was to simulate a bunch of random starting values for the anchor points and see where it converges from each one. That way instead of having just one starting set of values in the .yaml we would have a bunch and then we could compare how they end up.
While playing with the Calibration simulation with various data points I have noticed that the width and height initial settings make a big difference to how quickly the simulation converged. If the values are lower than the actual values it does not ever converge. If they are too high it will get better but may take multiple runs to get a good fitness.
That is a great point. Is it any amount lower that is triggering it to never converge or only if it’s a lot lower?
what is meant by ‘lower’?
we know the belt lengths at the first measurement point. If we were to draw arcs
for each arm and set the initial anchor guess outside those arcs is it good
enough?
or do the x coordinates need to be wider than the x coordinate if the frame was
1" high and the Y coordinate taller than if the frame was 1" wide?
I believe that the current starting guess is if the frame was perfectly square.
It is not a lot to cause the distortion. e.g. for a frame of nominal size 2000 x 3200, entering a “height” of 1925 will cause the simulation to distort and not converge. 1950 will find acceptable convergence. “Width” seems to be more forgiving; I haven’t found the failure point yet.
Entering a height of 4000 will take a while but will be approaching the convergence points, may require multiple starts but will reach convergence.